
The Speed You Actually Calculated
At first consideration, calculating vehicle speed and acceleration from video seems like an elementary task. However, closer examination of the process reveals unexpected depth.
Most of us are calculating speed by establishing how far a vehicle travels during a known period. For instance, in 0.667 seconds the vehicle traveled 46.9 feet. Therefore, the average speed of the vehicle was 46.9 / 0.667 = 70.3 ft/s or 47.9 mph.
If the vehicle was traveling at a constant speed, 47.9 mph is the true speed throughout. However, if the vehicle was accelerating or decelerating, we just calculated the average speed. Assuming acceleration is constant (which is usually all we can do), the slope of the speed trace during that period is constant, so the speed will be a straight line with a positive (accelerating) or negative (decelerating) slope.
The midpoint of that line is the average speed. For instance, if a vehicle is going 42 mph at the start of a one-second interval and 38 mph at the end, the average speed is 40 mph at 0.5 seconds. That’s what we’re calculating: the speed at the middle of the interval. In calculus, this is called the central difference approximation.
In the graph below, the average interval speed is shown as a bar, and a representative speed trace is shown in black… connecting the midpoints of each bar.
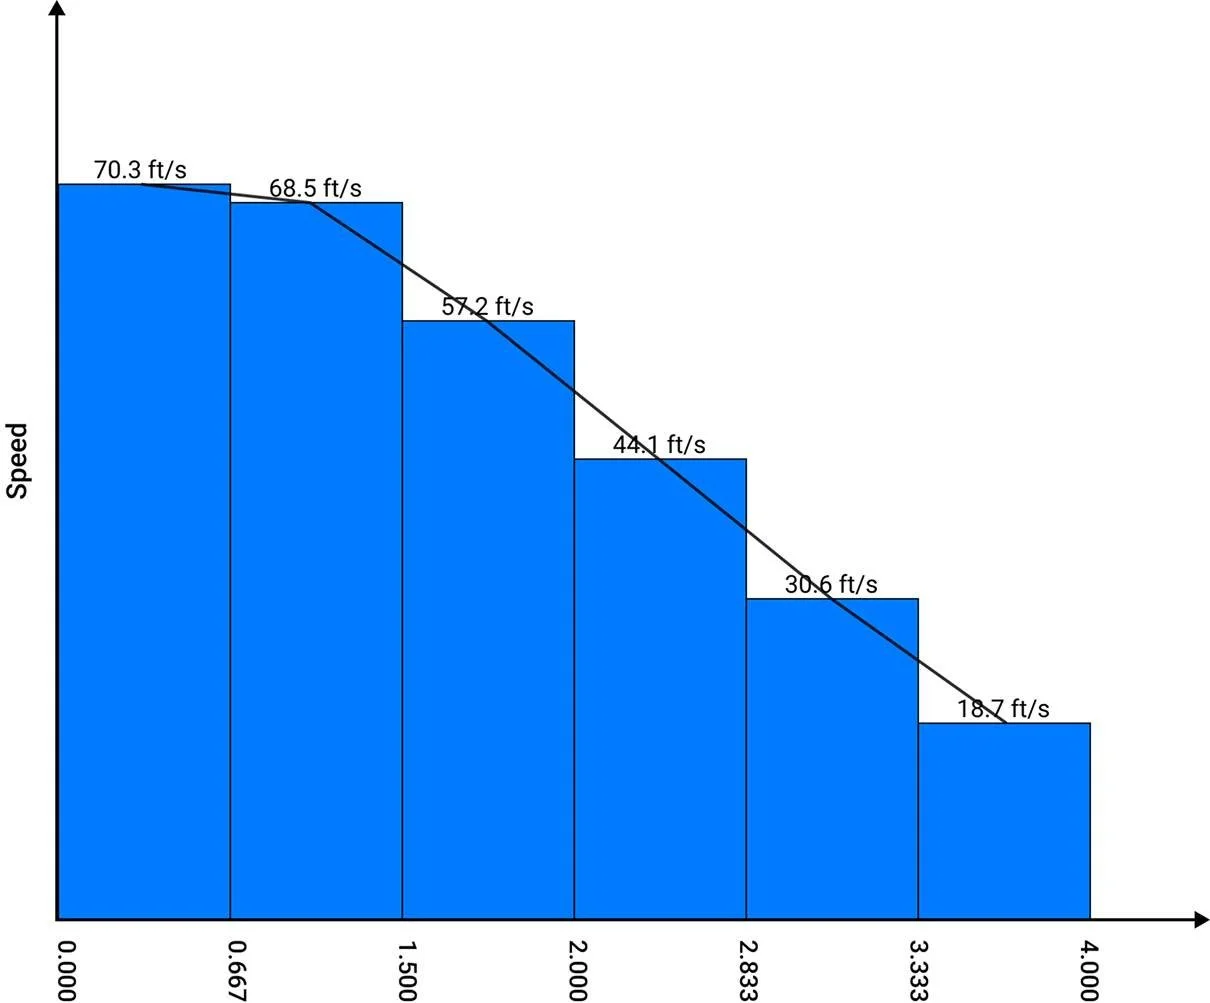
For acceleration, again, we’re assuming it’s constant. So, the value remains the same throughout the interval. Acceleration is simply the change in speed divided by the change in time. For the first interval in the graph above, that would be (68.5 - 70.3) / (1.083 - 0.333) = -2.4 ft/s2.
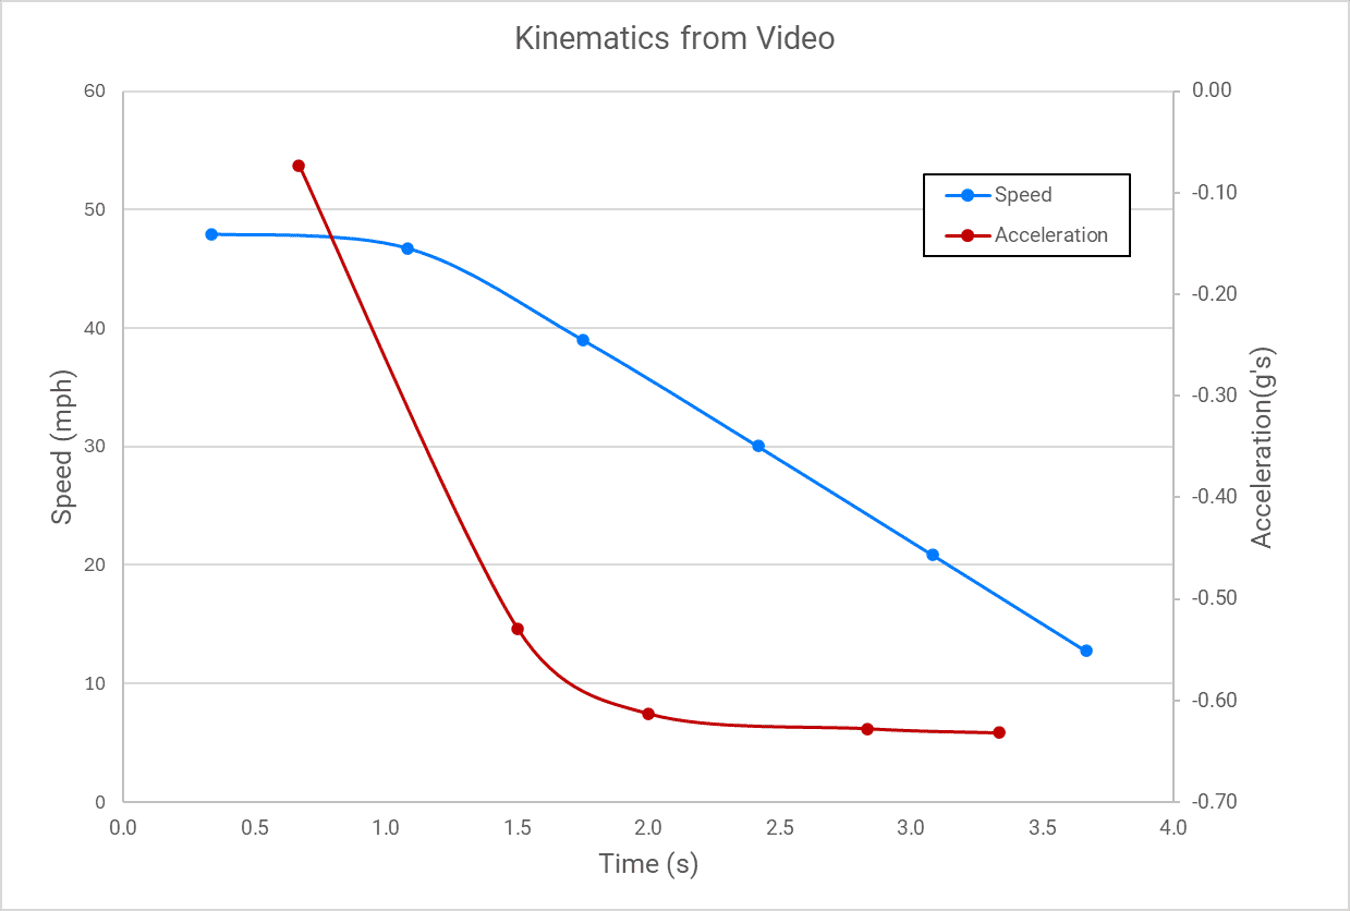
That -2.4 is constant between 70.3 and 68.5, but the natural place to plot the acceleration is at the chronological midpoint or the junction of the intervals. Choosing between these locations is a visualization decision, not a change in the underlying calculation. If the intervals are equal, those two are the same thing. In this example they're not, so the chronological midpoint is 0.708 while the junction is at 0.667 seconds. Plotting acceleration at the junctions, the speed and acceleration profiles here look like this:
Speed from video is easy to calculate and easy to get subtly wrong. Knowing what you calculated, and when it applies, is clutch.
Thanks for reading, keep exploring!
Lou Peck